Search for
Lipid Profile
Heart
8 parameters
Report in 4Hrs
At Home
Fasting Required
Details
Measures cholesterol, triglycerides, HDL, LDL.
₹219₹499
56% OFF
Parameters
- List of Tests
- Cholesterol/HDL
- LDL/HDL
- Non-HDL
- VLDL
- Total Cholesterol
- Triglycerides
- HDL
- LDL
Lipid Profile - Comprehensive Medical Test Guide
- Why is it done?
- The Lipid Profile is a comprehensive blood test that measures lipid metabolism and assesses cardiovascular disease risk by evaluating cholesterol and triglyceride levels in the bloodstream
- Total Cholesterol provides an overall measure of all cholesterol in the blood; HDL (high-density lipoprotein) measures protective cholesterol; LDL (low-density lipoprotein) measures cholesterol that may contribute to atherosclerosis; VLDL (very low-density lipoprotein) indicates triglyceride-carrying particles; Triglycerides measure fat storage molecules; Cholesterol/HDL and LDL/HDL ratios assess cardiovascular risk; Non-HDL cholesterol identifies all atherogenic particles
- Primary indications include screening for cardiovascular disease risk, monitoring lipid management in patients with coronary artery disease, heart attack, or stroke history, evaluating patients with family history of early heart disease, and assessing metabolic disorders
- Recommended for all adults over age 20 as part of preventive healthcare screening; more frequently for patients with hypertension, diabetes, obesity, or established cardiovascular disease
- Used to guide treatment decisions for statin therapy, assess effectiveness of cholesterol-lowering medications, evaluate dietary and lifestyle interventions, and determine need for additional cardiac risk assessment
- The individual tests work synergistically to provide a complete lipid profile: Total Cholesterol gives overall burden; HDL and LDL give lipoprotein distribution; Triglycerides reveal fat metabolism; VLDL correlates with triglyceride levels; and ratios provide risk stratification
- Normal Range
- Total Cholesterol: <200 mg/dL (desirable); 200-239 mg/dL (borderline high); ≥240 mg/dL (high) - measured in mg/dL or mmol/L (divide by 38.67 for conversion)
- LDL Cholesterol: <100 mg/dL (optimal); 100-129 mg/dL (near optimal); 130-159 mg/dL (borderline high); 160-189 mg/dL (high); ≥190 mg/dL (very high)
- HDL Cholesterol: <40 mg/dL in men (low); <50 mg/dL in women (low); ≥60 mg/dL (protective) - higher HDL is better for cardiovascular health
- Triglycerides: <150 mg/dL (normal); 150-199 mg/dL (borderline high); 200-499 mg/dL (high); ≥500 mg/dL (very high)
- VLDL Cholesterol: <30 mg/dL (normal); calculated as Triglycerides ÷ 5 in mg/dL measurement
- Total Cholesterol/HDL Ratio: <5.0 is desirable; >5.0 indicates increased cardiovascular risk
- LDL/HDL Ratio: <3.5 is optimal; >5.0 indicates significantly increased cardiovascular risk
- Non-HDL Cholesterol: <130 mg/dL (desirable); 130-159 mg/dL (borderline); ≥160 mg/dL (high); calculated as Total Cholesterol minus HDL
- All lipid values are measured in mg/dL in the United States; SI units (mmol/L) are used internationally
- Interpretation
- Total Cholesterol: Elevated levels indicate excess cholesterol in blood, which may deposit in arterial walls; borderline high requires lifestyle modifications; high levels warrant pharmacological intervention and risk assessment
- LDL Cholesterol (bad cholesterol): Elevated LDL is major risk factor for atherosclerosis and coronary artery disease; lower values are protective; LDL becomes increasingly atherogenic when oxidized; goals vary by cardiovascular risk profile
- HDL Cholesterol (good cholesterol): High HDL is protective against cardiovascular disease; removes excess cholesterol from bloodstream; low HDL increases cardiovascular risk even with normal total cholesterol; acts as reverse cholesterol transporter
- Triglycerides: Elevated triglycerides increase cardiovascular risk, especially when combined with low HDL; very high levels increase pancreatitis risk; fasting status significantly affects values
- VLDL Cholesterol: Elevated VLDL indicates excess triglyceride-rich lipoprotein particles; associated with metabolic syndrome; directly correlates with triglyceride levels
- Total Cholesterol/HDL Ratio: Lower ratios indicate better cardiovascular health; ratio <5.0 is optimal; increasing ratios with elevated total cholesterol or low HDL indicate higher risk
- LDL/HDL Ratio: Evaluates balance between harmful and protective cholesterol; lower ratios indicate better cardiovascular profile; ratio >5.0 indicates significantly increased atherosclerotic risk
- Non-HDL Cholesterol: Represents all potentially atherogenic lipoprotein particles; may be more predictive of cardiovascular risk than LDL alone; particularly useful in patients with high triglycerides
- Factors affecting interpretation: Recent food/alcohol intake, acute illness or recent myocardial infarction (cholesterol drops temporarily), medications (statins, estrogens, corticosteroids), pregnancy, liver disease, kidney disease, and genetic predisposition all influence lipid values
- Associated Organs
- Heart: Primary organ evaluated; abnormal lipid profiles directly increase risk of myocardial infarction, angina, and sudden cardiac death; atherosclerotic plaque formation in coronary arteries is lipid-driven process
- Blood Vessels (Arteries and Veins): Lipid profile monitors vascular health; elevated LDL promotes atherosclerotic plaque formation; low HDL impairs vascular protection; abnormalities lead to peripheral arterial disease, carotid artery disease, and cerebrovascular accident risk
- Liver: Primary organ synthesizing cholesterol and VLDL; abnormal lipid profiles may indicate hepatic dysfunction or metabolic abnormalities; lipid metabolism occurs primarily in liver
- Pancreas: Very high triglycerides (>500 mg/dL) significantly increase acute pancreatitis risk; lipase elevation risk correlates with severe hypertriglyceridemia
- Brain: Lipid abnormalities increase stroke risk through atherosclerotic disease in carotid and cerebral arteries; elevated cholesterol is modifiable risk factor for cerebrovascular disease
- Kidneys: Abnormal lipid profiles associated with chronic kidney disease progression; lipid abnormalities common in nephropathy; kidney dysfunction impairs cholesterol clearance
- Adipose Tissue: Body fat distribution influences lipid metabolism; visceral adiposity associated with dyslipidemia and abnormal ratios
- Complications from abnormal results: Coronary artery disease, acute myocardial infarction, stable or unstable angina, heart failure, arrhythmias, sudden cardiac death, stroke, transient ischemic attack, peripheral arterial disease, aortic disease, pancreatitis (severe hypertriglyceridemia), xanthomas (lipid deposits), and premature atherosclerosis
- Follow-up Tests
- For Abnormal Total Cholesterol: Repeat lipid panel to confirm; calculate 10-year atherosclerotic cardiovascular disease (ASCVD) risk; consider high-sensitivity C-reactive protein (hs-CRP) for additional risk stratification; assess for secondary causes of hypercholesterolemia
- For Abnormal LDL: Lipoprotein(a) measurement to identify genetic hyperlipidemia; advanced lipoprotein particle analysis (NMR or ion mobility); carotid intima-media thickness ultrasound; coronary artery calcium score CT; consider genetic testing for familial hypercholesterolemia
- For Low HDL: Assess lifestyle factors; evaluate for metabolic syndrome; screen for type 2 diabetes; investigate for secondary causes (smoking, sedentary lifestyle, hypertriglyceridemia); consider medication optimization
- For Elevated Triglycerides: Repeat fasting lipid panel; liver function tests; fasting glucose or HbA1c for diabetes screening; TSH for thyroid dysfunction; renal function assessment; consider genetic testing if severe hypertriglyceridemia; lipase if level >500 mg/dL
- For Elevated VLDL: As above with elevated triglycerides; assess for metabolic syndrome and insulin resistance; evaluate dietary composition
- For Abnormal Ratios (Cholesterol/HDL, LDL/HDL): Obtain full ASCVD risk assessment; baseline electrocardiogram if multiple risk factors; consider stress testing if symptomatic; evaluate for metabolic syndrome
- For Elevated Non-HDL: All investigations as for elevated LDL; particularly important if triglycerides are also elevated
- General Follow-up Recommendations: Repeat lipid panel 4-12 weeks after starting statin therapy; then annually for stable patients; more frequently if doses adjusted; baseline and periodic liver function tests with statin use; baseline and periodic creatine kinase if symptomatic; reassess every 2 years if normal and low risk
- Complementary Tests: Comprehensive metabolic panel; thyroid-stimulating hormone; glucose or hemoglobin A1c; blood pressure monitoring; body mass index assessment; waist circumference measurement; high-sensitivity CRP; ASCVD risk calculator application
- Fasting Required?
- Yes - Fasting is required for accurate lipid profile testing, particularly for Triglycerides and VLDL which are significantly affected by recent food intake
- Fasting Duration: 9-12 hours of fasting is standard; most commonly overnight fast (nothing after midnight, blood drawn in morning); minimum 9 hours, maximum 16 hours recommended
- Dietary Restrictions: No food consumption during fasting period; no caloric beverages; water is permitted and encouraged; black coffee or unsweetened tea without milk acceptable (check with laboratory)
- Medications: Most routine medications can be continued; however, consult ordering physician about specific medications; statin medications should not be skipped (continue as prescribed); some beta-blockers and thiazide diuretics may affect lipids but should not be stopped without physician guidance
- Alcohol Consumption: Avoid alcohol for 24 hours before testing as it significantly elevates triglycerides; can persist for extended period after consumption
- Physical Activity: Normal exercise routine can be maintained; strenuous exercise day before testing may transiently affect lipid values; light activities are permitted
- Patient Positioning: Patient should be seated for 5 minutes before venipuncture; some laboratories require supine positioning; follow laboratory-specific instructions
- Special Circumstances: Recent acute illness, myocardial infarction, or major surgery may lower cholesterol for 4-12 weeks; testing should be delayed; pregnancy affects lipid values; testing should be delayed until 6-8 weeks postpartum
- Timing Consistency: For reliable comparison of results over time, fasting should be consistent (same time of day, same fasting duration) when possible
- Non-fasting Testing: Some recent guidelines allow non-fasting lipid testing; non-fasting total cholesterol, LDL, and HDL are relatively stable; triglycerides and VLDL significantly elevate after eating; confirmation with fasting values may be recommended
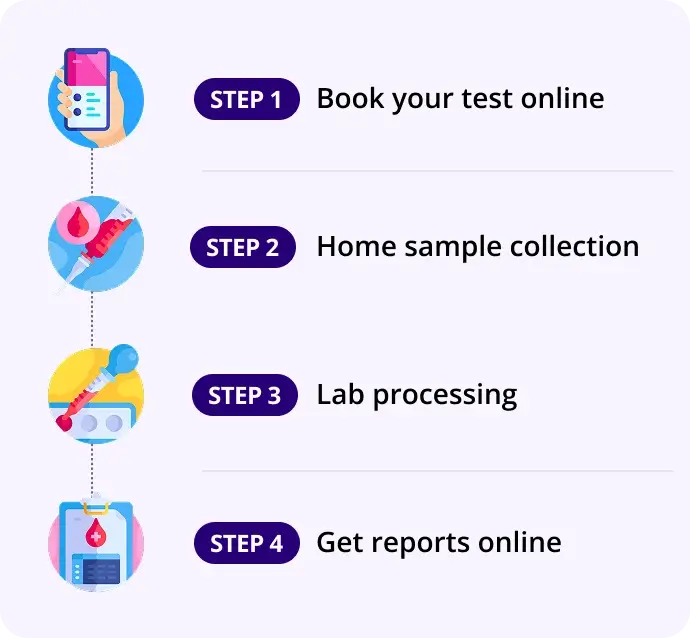
How our test process works!

